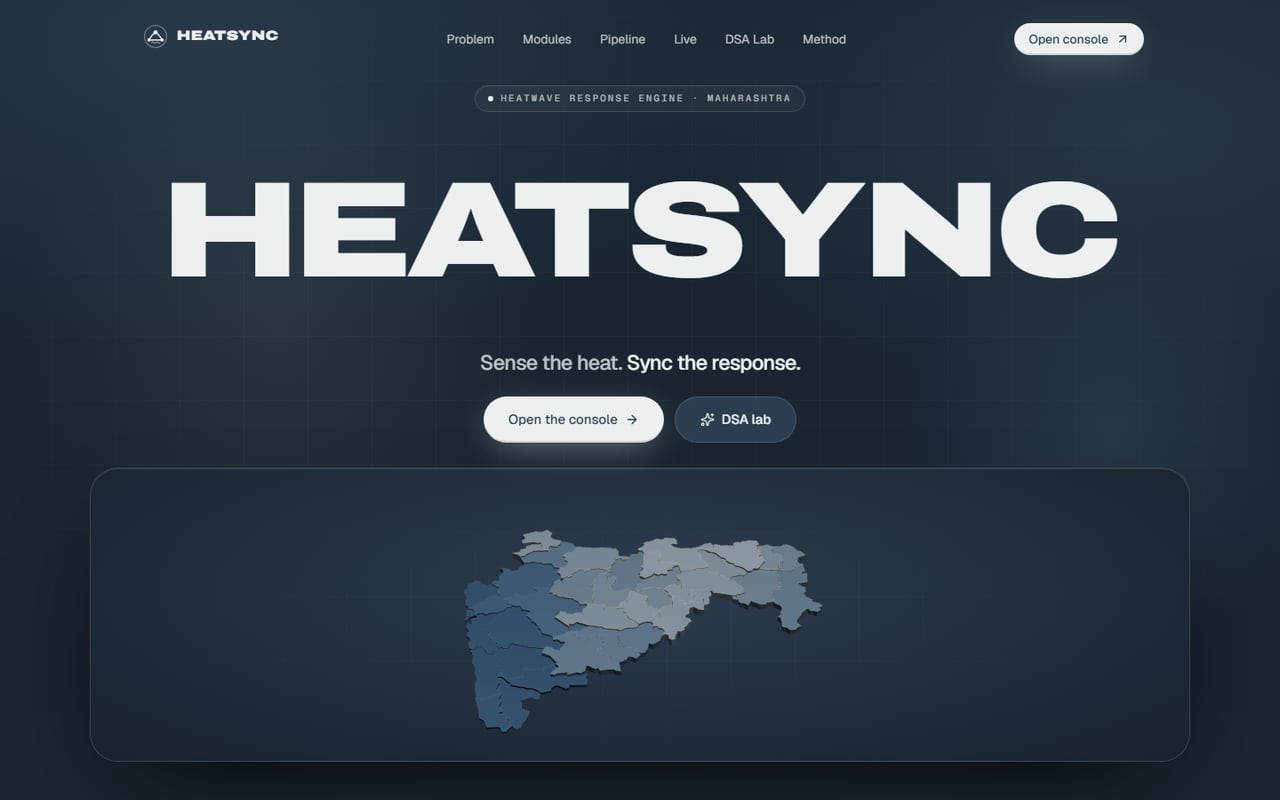
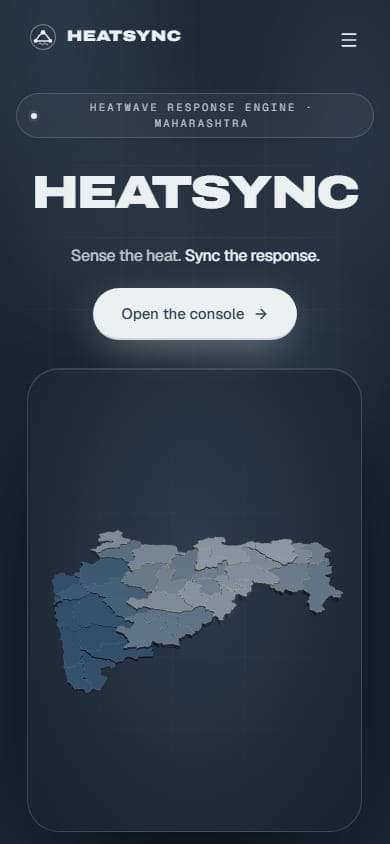
HEATSYNC
Sense the heat. Sync the response.
- Year
- 2026
- Status
- Live
- Category
- Full-Stack
01 / Overview
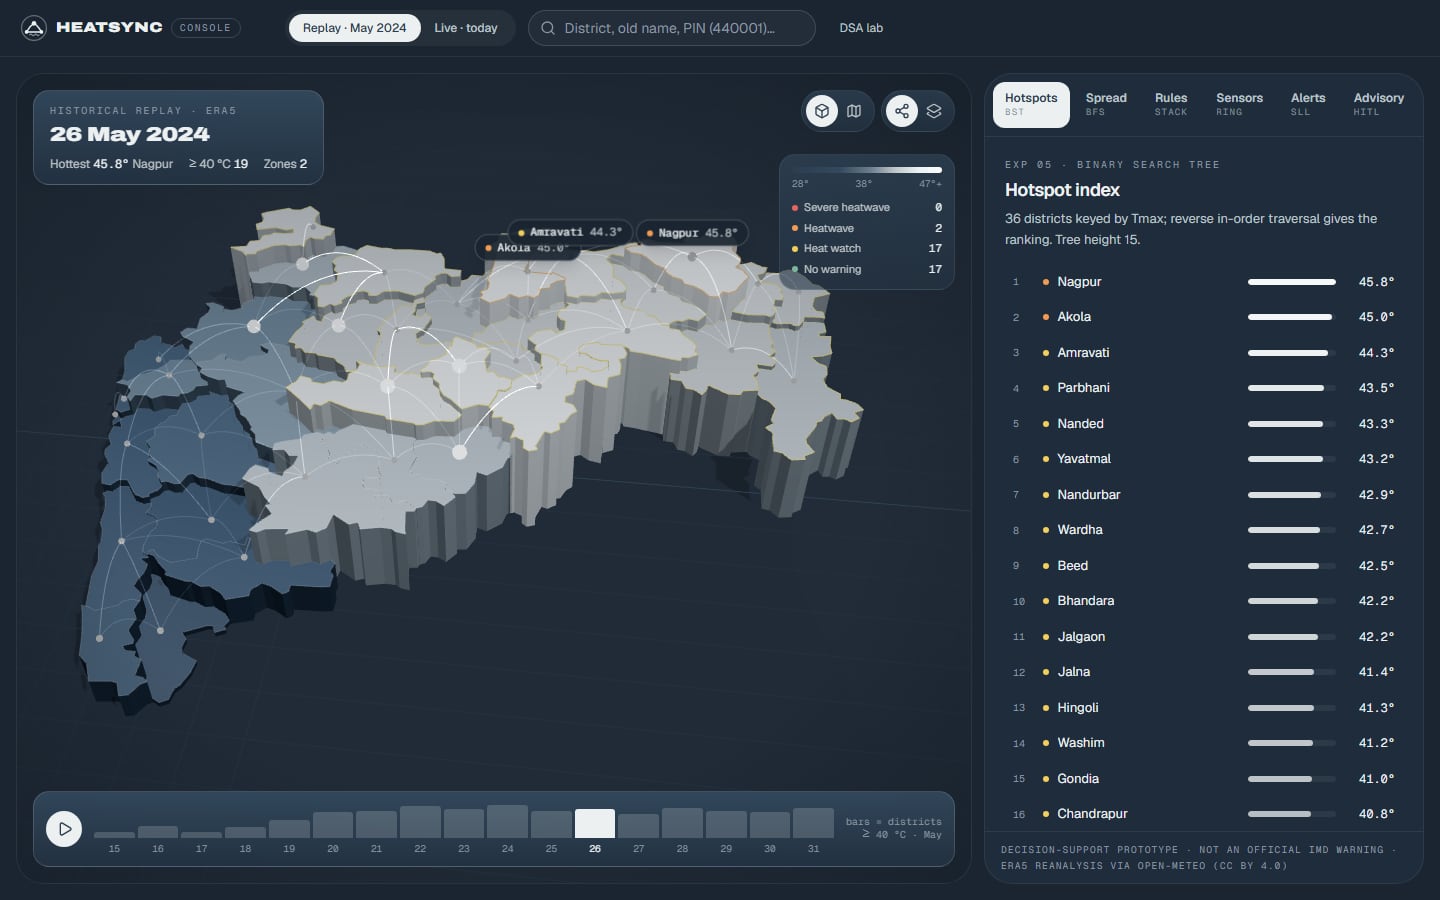
HEATSYNC turns raw temperature data into a coordinated heatwave response for Maharashtra's 36 districts: a live hotspot ranking, contiguous heat zones, alert rings across district borders, relief staging from the nearest cooler district, and advisories written for different audiences. Every one of those steps is powered by a classic data structure from the Data Structures course, from an array of structures to a hash table.
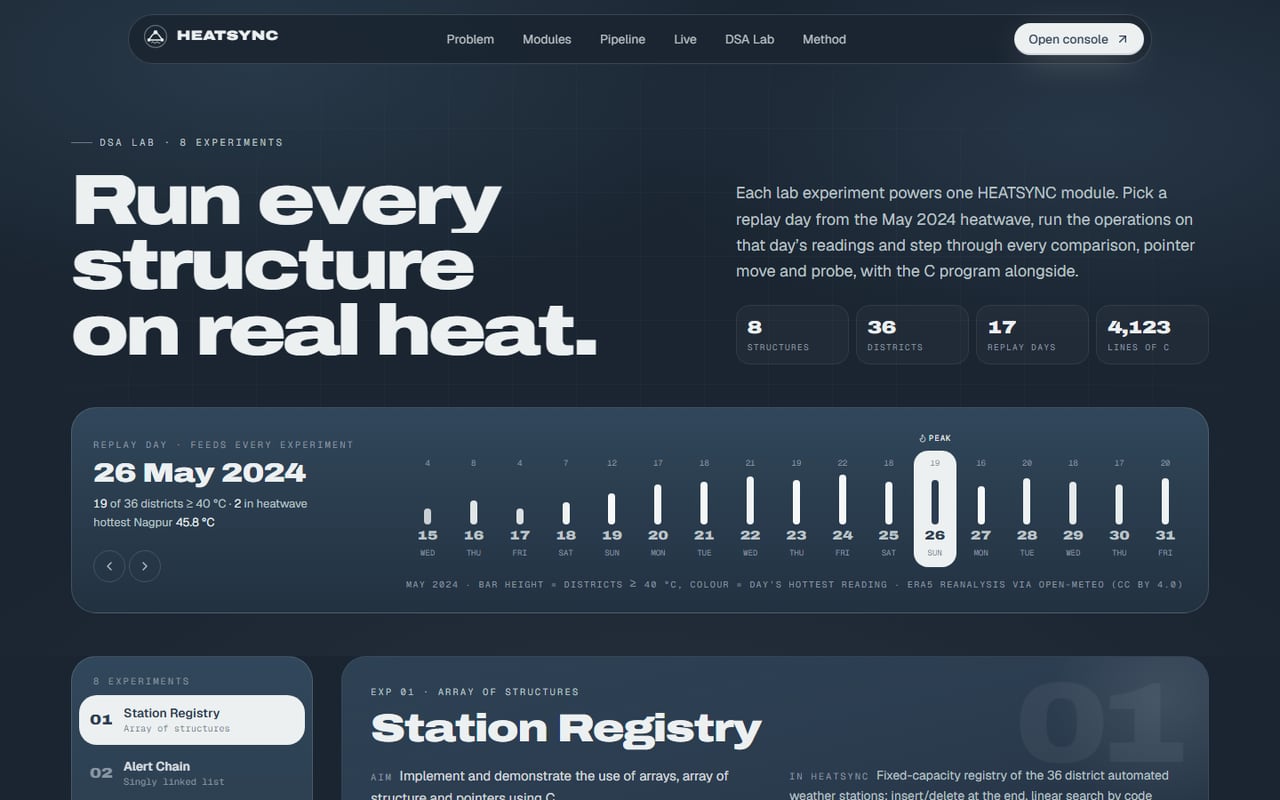
It runs on real data with no database and no API keys: ERA5 reanalysis for 36 district points from 2015 to 2025 (48,312 daily values), a day-by-day replay of the 15–31 May 2024 heat spell, live 7-day guidance from Open-Meteo, and district borders from geoBoundaries. A response console shows it all on an interactive 3D or 2D map, and a DSA lab runs every structure on that real data step by step, with the C source alongside.
02 / Problem
During a heatwave, district control rooms must decide every day, for 36 districts, which areas are worst, which neighbours are next, where relief can be staged from, and what to tell citizens, farmers and hospitals.
The inputs exist (hourly weather, decades of reanalysis, IMD's criteria) but arrive scattered: rankings are rebuilt by hand, neighbouring districts are warned one at a time, and one forecast has to be rewritten for four audiences.
03 / Solution
- 01Station Registry (array of structures): 36 fixed slots, one per district weather station.
- 02Alert Chain (singly linked list): newest bulletin at the head, follow-ups inserted after the bulletin they update.
- 03Rule Compiler (stack, infix to postfix): IMD heatwave criteria written as rules, compiled and evaluated per district.
- 04Sensor Ring (circular queue): 24 hourly readings per station, with a rolling 24-hour maximum.
- 05Hotspot Index (binary search tree): districts keyed by maximum temperature; reverse in-order traversal gives the ranking.
- 06Heat Spread Graph (adjacency matrix and BFS): 77 real shared borders give contiguous hot zones, alert rings and the nearest cooler district.
- 07Climate Archive (sorting and binary search): 1,342 season days per district sorted once, so today's heat is ranked in O(log n).
- 08Instant Lookup (hash table with linear probing): a district by name, former name, station code or PIN in O(1) on average.
04 / Features
- 01A first-visit intro whose loader is a live breadth-first search that advances only as real assets become ready
- 02A scroll-driven landing with a real-data 3D map of Maharashtra and footage transitions between sections
- 03Response console: replay the May 2024 heat spell day by day or follow today's guidance, on an interactive 3D/2D map, with hotspot, spread, rules, sensor, alert, advisory, registry and archive panels
- 04Advisories drafted for each audience that stay drafts until a person approves them
- 05DSA lab: run every structure on real data and replay each operation step by step, with the C source alongside
- 06160+ unit tests for the data-structure engine
05 / Architecture
- 01Next.js 16 App Router, React 19, TypeScript, Tailwind CSS 4
- 02three.js, React Three Fiber, drei and postprocessing for the 3D map; GSAP with ScrollTrigger and SplitText, Lenis and Motion for the scroll story
- 03Eight data structures in lib/ds, each returning step traces for the lab; engine.ts makes them do the product's work
- 04Data: ERA5 reanalysis via Open-Meteo (CC BY 4.0), Open-Meteo forecast API cached for 30 minutes, geoBoundaries district polygons (ODbL / CC BY), IMD heatwave criteria
- 05C versions of all eight experiments, adapted to the use case and tested on real data
06 / Screens